Component Browser
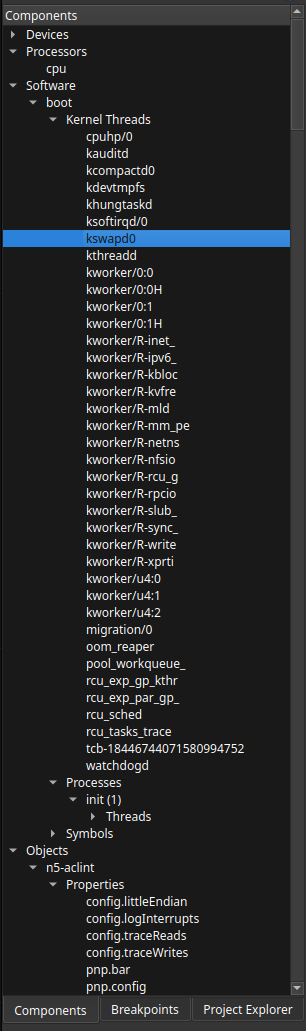
The Component Browser is the main navigation tree for live target contexts, boards, symbols, and TEMU object paths. It is the quickest way to move from a high-level target overview into specific GUI tools such as memory, registers, disassembly, stack traces, watchpoints, and object inspection and memory/symbol inspections.
Opening and Refreshing the Tree
The Components dock populates after a successful TCF connection. If the target disconnects, the tree is cleared and repopulates on the next connection.
The dock title bar includes a refresh button. Use it when the target has created or removed contexts and you want the browser to reload immediately.
Structure and Default Expansion
The tree is hierarchical:
- Root nodes
-
Top-level containers such as boards or object groupings.
- Intermediate nodes
-
CPUs, peripherals, software contexts, threads, symbols, or object folders.
- Leaf nodes
-
The most specific item available for the selected branch, such as a concrete symbol or object.
After a refresh, the debugger automatically expands the main board structure so you can reach the interesting runtime nodes quickly. The Symbols container remains collapsed until you open it explicitly.
Navigation
-
Use the disclosure triangles to expand or collapse a branch.
-
Hovering a node shows a tooltip with the available metadata for that context.
-
Selecting a different row updates the debugger’s current context tracking.
-
Double-clicking a row requests a stack trace for that context.
Context Menu Actions
Right-click a node to open the context-sensitive menu. The available actions depend on the type of node you selected.
- Get Stack Trace
-
Requests a stack trace for the selected context and opens the stack/variables panel with the result.
- Get Registers
-
Loads registers for the selected context into the Registers panel.
- View Memory
-
Opens the Memory view at the selected context when the memory service is available.
- Get Disassembly Capabilities
-
Available on CPU contexts. Use it before disassembling when you want the debugger to query supported instruction-set options from the target.
- Disassemble Symbol
-
Available on symbol and compilation-unit nodes. Opens the disassembly view for the selected symbol.
- Add Watchpoint
-
Available on symbol leaves. Creates a watchpoint for that symbol and routes it to the watchpoint system.
- Inspect Symbol
-
Available on symbol leaves. Opens the Inspector view with a detailed tree showing the symbol’s type structure, all fields, nested composites, arrays, and current values. See Inspector View for more details.
- Inspect Object Properties
-
Available under the
/Objectsbranch. Opens the Object Properties panel for the selected object path.
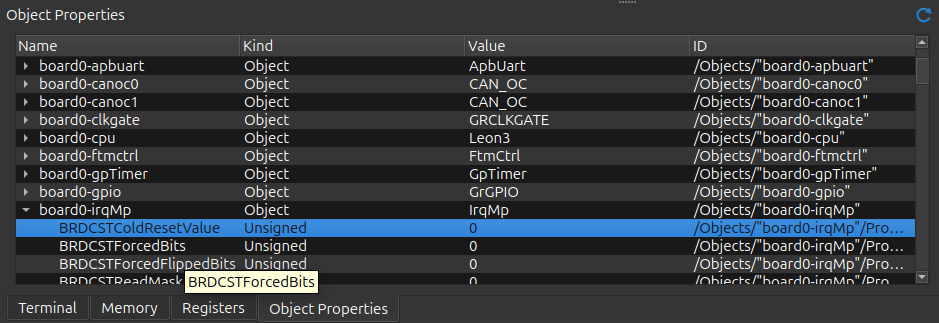
Object Properties Panel
The Object Properties panel is tightly coupled to the Component Browser. When you choose Inspect Object Properties, the bottom dock shows a hierarchical property tree for the selected object.
The table provides these columns:
- Name
-
The object or property name.
- Kind
-
The property kind or class information.
- Value
-
The current value when one is available.
- ID
-
The underlying object or property identifier.
Expanding an object row requests its properties on demand, so large object trees do not need to load everything at once. The refresh button on the dock title bar asks the debugger to rebuild the browser and restore the expanded objects where possible.
Capability Icons on Nodes
Nodes in the Component Browser can show multiple icons on the right side of the row. Each icon describes either a capability that the selected context exposes or a special role that the node plays in the tree.
| Icon | Meaning |
|---|---|
|
CPU — the node is a processor execution context. This is typically the context you use for disassembly and CPU-focused navigation. |
|
Thread — the node represents a thread context. Thread nodes are the usual entry point for stack traces and thread-specific run control. |
|
Registers — the context exposes register access. The Get Registers action is meaningful on these nodes. |
|
Memory — the context exposes memory access. The View Memory action is available when this capability is present. |
|
Run Control — the context can be suspended, resumed, or both. These nodes participate directly in debugger execution control. |
|
Contains children — the node is a container or grouping node with nested contexts below it. This is used for structural folders such as the Symbols container and other expandable groupings. |
|
Object — the node belongs to the |
|
Property — the node is part of the |
|
Software — the node belongs to the software/application branch of the target model. This helps distinguish software contexts from board, CPU, or object nodes. |
|
Symbol — the node is in the symbol hierarchy, such as a symbol leaf or an entry under an application’s Symbols branch. These nodes are the ones used for symbol inspection, watchpoints, and symbol-based disassembly. |
|
Generic context — the node has no more specific icon match, so the browser shows the default bus-style marker. You will commonly see it on generic buses, peripheral groupings, or other structural contexts. |
| The Component Browser is read-only. Change state through the appropriate debugger service, scripting workflow, or other dedicated GUI action rather than by editing the tree directly. |