Connecting to a Debug Target
Opening the Connection Dialog
Access the connection dialog via: - TCF → Connect from the menu bar - Connect button on the run control toolbar (chain link icon)
Connection Settings
-
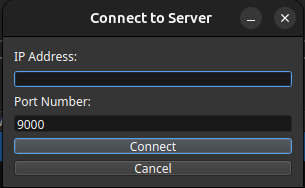
IP Address: Enter the hostname or IP address of the machine running the TCF server. Use localhost or 127.0.0.1 if TEMU is running locally.
-
Port: The TCF server port number. Default is 9000. This must match the port configured in your TEMU TCF server settings.
Connection Process
-
Click Connect — the button changes to "Connecting…"
-
The debugger establishes a TCF protocol handshake
-
On success, the dialog closes and the Component Tree populates with available contexts
-
On failure, an error dialog appears with the reason
After Connecting
-
The Component Browser shows available CPUs, peripherals, Software, Objects, CUs and symbols
-
Select a CPU or Thread context from Run control toolbar to enable debugging features
-
The context dropdown in the toolbar lists available execution contexts