Disassembly View User Guide
Introduction
The disassembly view in the TEMU System Debugger lets you inspect the raw machine instructions that correspond to the program you are debugging. It provides a window into what the CPU sees, helping you understand low‑level behavior, investigate crashes, and verify that your code is executing as expected.
Opening the Disassembly View
The disassembly window is usually accessible from the main menu On bootup or can be switched to via the 'View' menu in the system toolbar. It becomes enabled once you connect to a target and a CPU with ISA capabilities is available. If the view is empty, you may need to select a thread and disassembele a stack frame in the callstack contextmenu or resume execution until instructions are available.
Basic Layout
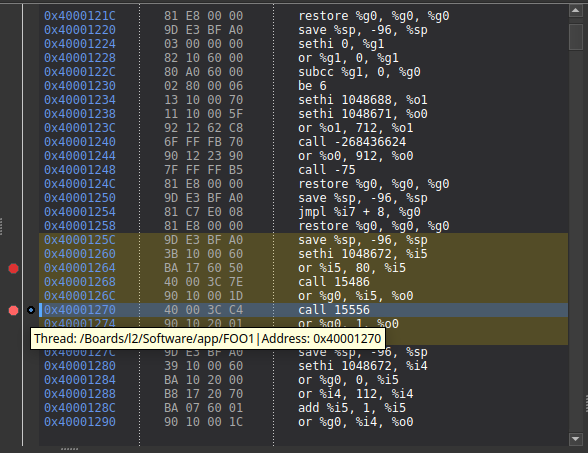
The view is divided into three columns:
- Address
-
shows the memory address of the instruction.
- Opcode
-
displays the raw bytes of the instruction in hexadecimal form.
- Instruction
-
shows the human‑readable assembly mnemonic and operands.
You can resize each column by dragging the separators in the header.
Navigating the Code
-
Scroll with the mouse wheel or use the scrollbar on the right. The view loads additional instructions on demand, so you can scroll through large regions without pre‑loading everything.
-
Jump to address by right‑clicking a breakpoint in the breakpoint view.
-
Scroll to line by clicking on an entry and pressing the down/up arrows or PgDn/PgUp keys.
The view employs an infinite scrolling mechanism: as you approach the top or bottom of the cached region, additional instructions are fetched automatically, keeping the display responsive.
Selecting and Copying Instructions
Click and drag over the lines to select one or more instructions. The selection highlights across all three columns.
-
Select All – use the Edit menu or Ctrl+A to select the entire contents of the view.
-
Copy – press Ctrl+C or choose "Copy" from the context menu to place the selected lines on the clipboard. The copied text preserves the address, opcode and instruction columns.
Breakpoints and Gutter Plugins
The disassembly view integrates with the breakpoint system:
-
Clicking in the left‑hand gutter toggles a breakpoint on that address. A small red indicator appears.
-
A custom gutter may show additional information such as thread pointers or execution markers; these are provided by plug‑ins and appear automatically if enabled.
You can inspect or navigate to breakpoints using the dedicated breakpoint panel.
Execution Point Highlighting
When the program is running, the currently executing instruction is highlighted in a distinct color. The view supports multiple execution points, one for each thread.
To jump to an execution point explicitly, use the context selection dropdown that is located in the Run Control Bar. The relevant line is centered in the view.
Context Menu Actions
Right‑clicking within the disassembly view opens a context menu offering:
-
Copy – copy selected lines or the line under the cursor. The option to copy from address, opcode or instruction will be available in the menu depending on the region you click.
Working with Symbol Highlights
Symbols imported from the debug information (e.g. function or variable names) are automatically highlighted in the disassembly when you navigate to their addresses. You can also manually specify a range corresponding to a particular memory sector via the memory view; the view will draw a shaded rectangle around that region.
Choosing Instruction Set Architecture (ISA)
If the target supports multiple ISAs (for example, in a mixed‑mode system), the view will offer a selection list of available architectures. Choose the ISA that matches the code you are examining to ensure correct decoding of opcodes.
The debugger retrieves the list of supported ISAs from the target when a connection is established and caches it for reuse. The current ISA selection affects all disassembly requests.
Chunked Disassembly
To preserve performance when scrolling large address ranges, the view performs disassembly in chunks. Each chunk consists of a set number of instructions (typically a few thousand) and is stored in an internal cache. When you move to a new area of memory, only the necessary chunks are fetched from the target.