Memory Inspection
This document describes the Memory View in the TEMU System Debugger. It is written for users of the debugger and explains the interface and interaction patterns you will use when examining live memory. No programming knowledge is required.
Overview
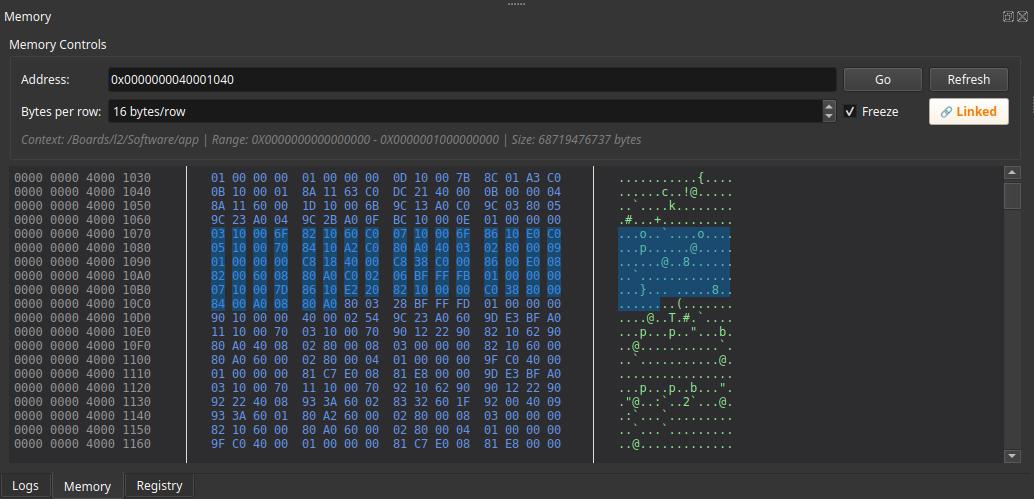
The Memory View presents a block of target memory organized in a familiar "hex editor" layout. An address column on the left shows the start of each row, followed by a grid of hexadecimal byte values and an ASCII translation on the right. You can scroll, jump to addresses, copy values, and even request disassembly of instructions found in memory. The control panel at the top lets you customise the view and navigate through contexts provided by the debugger.
Opening the Memory View
The view is available from the main menu or via a tab button labelled Memory around the dock. When you first open it no memory is displayed. The view will automatically load the memory associated with the current debugger context once the connection is established.
Control Panel
At the top of the Memory View is the control panel, which contains all of the interactive widgets you will use frequently.
Address Navigation
- Address
-
A hexadecimal text box where you may enter any address you wish to inspect.
- Type the address with or without the
0xprefix and press Enter -
or click the Go button to jump. The view aligns the requested address to the beginning of a row.
- Go
-
Executes the jump to the address entered in the box.
- Refresh
-
Forces the view to re‑read memory at the current address. This is useful if the target process has modified memory and you want to see the latest contents immediately.
Display Options
- Bytes per row
-
A spin box allowing you to choose how many bytes are shown on each line. Valid values range from 8 to 64. Changing this value automatically reloads the view and keeps your current position.
- Freeze
-
A checkbox that toggles auto‑refresh. When unchecked the view periodically reloads memory to reflect changes in the target (default behaviour). Checking Freeze stops automatic updates and locks the view at the current contents. Selecting data will also enable the freeze automatically so that the selection does not blur.
Copy Mode
A single button shows the current copy mode. Clicking it cycles through three modes:
- Linked
-
Copies all three representations together: the hex bytes, the ASCII rendering, and the raw byte string.
- Hex
-
Copies only the hexadecimal byte values.
- ASCII
-
Copies only the printable ASCII rendering (non-printable bytes become
.).
A tooltip on the button explains these options in more detail. The button’s appearance changes to reflect the active mode.
Context Information
A descriptive label shows which memory context is currently active. This typically reflects the application or memory device you are connected to and updates automatically when the debugger switches contexts. While contexts are being discovered the label displays a message such as "Discovering contexts…" and the address controls are disabled until a valid context is selected.
Scrolling and Navigation
Memory is displayed in an "infinite scroll" container. You can use the vertical scroll wheel, drag the scrollbar, or press the Page Up/Page Down keys to move through memory. The view fetches data as needed, so you can navigate across a very large address space without loading everything at once.
Clicking on an address (the value shown in the address column) will take you directly to that address. You can also use the horizontal scrollbar to adjust the display offset, effectively shifting the columns left or right if they do not fit on screen.
The view supports keyboard navigation:
- ↑ / ↓
-
Move the caret one byte at a time.
- Ctrl‑A
-
Selects all visible memory.
- Ctrl‑C
-
Copies the current selection according to the active copy mode.
Selection and Copying
You can select a range of bytes by clicking and dragging in either the hex or ASCII area. Selection extends across rows naturally. Cross‑row selection is preserved when you scroll or resize the window. Selected bytes are highlighted and the freeze checkbox will be enabled automatically to prevent the display from changing while you examine or copy data.
When a selection exists the view emits information about it; the log output (if enabled) will show both the hex and ASCII representation of the selected data. Use Ctrl‑C or the context menu to copy the selection in the chosen format. The context menu also offers convenient commands such as "Copy Address" or "Copy Hex" regardless of the current copy mode.
Context Menu
Right‑clicking anywhere in the memory area brings up a context menu with additional actions:
- Copy
-
Copies the currently selected bytes.
- Copy Address
-
Places the address under the cursor on the clipboard.
- Copy Hex/ASCII
-
Explicit control over which representation is copied.
- Select All
-
Selects every byte currently visible.
- Inspect Memory
-
Available when bytes are selected. Opens the Inspector view and attempts to automatically infer a type for the selected memory region. The Inspector displays the memory contents interpreted as a structure based on heuristics. See Inspector View for more details.
- Assume Type…
-
Available when bytes are selected. Opens a dialog allowing you to manually select a type (e.g.,
struct,int,float) to interpret the selected memory. After choosing a type, the Inspector view displays the memory formatted according to that type’s definition. This is useful when inspecting dynamically allocated memory or memory-mapped I/O where no symbol information exists. - Disassemble
-
If a memory region at the clicked address contains executable code, you can request disassembly. The disassembled instructions will appear in the disassembly view or a pop‑up depending on configuration.
This menu adapts to the context; it remains disabled until a memory row is under the pointer.
Integration with Disassembly and Other Views
The Memory View is tightly connected with other components of the debugger:
-
Disassembly requests – double‑clicking (or using the context menu) on an instruction triggers a disassembly request. The disassembly window will show the corresponding machine instructions for the selected address.
-
Inspector – selecting bytes and using Inspect Memory or Assume Type… opens the Inspector view with the memory interpreted as a typed structure. This integration allows seamless navigation from raw bytes to structured data views.
-
Context manager – when the debugger switches to a new process/thread or load module, Memory View updates automatically. You can see which context is active in the context info label and you may manually switch by using the context manager widget elsewhere in the UI.
Tips and Tricks
-
Use the Bytes per row setting to make the view wider or narrower depending on your monitor or to align with natural word sizes (32‑bit vs 64‑bit).
-
The freeze checkbox is handy when you’re watching a changing buffer such as a log file or shared memory region; enable it to pause the view and step through at your own pace.
-
Change the copy mode before making a selection if you know you only need one representation; this avoids having to post‑process the clipboard contents.
Troubleshooting
-
If memory fails to load, ensure that you have a valid debugging context and that the process is still running. The context info label will show errors if the memory service reports a problem.
-
Very large caches are managed automatically, but if you notice sluggishness you can clear the view by clicking Refresh or by switching to a different address range. The application will keep only a limited amount of data in memory and will discard old pages as you move around.
-
When the address input box refuses to accept an entry, check that you are using hexadecimal digits only. The box accepts both upper‑ and lower‑case letters.