Stack Trace and Variables Widget
Stack Trace and Variables panel in the TEMU System Debugger gives the user an insight into the current state of the call stack and stack frames as well variable views. A stack trace may be gotten for each suspendable context.
Layout
When the debugger is running, the panel is normally placed on the right- hand side of the main window. It is divided vertically into two linked views by a movable splitter:
- Stack trace
-
the upper half shows the call stack for the current thread.
- Variables
-
the lower half displays the contents of local variables and parameters for whatever stack frame is selected above.
You can drag the splitter bar up or down to give more space to either view.
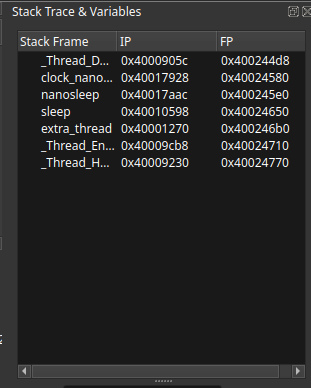
Stack Trace Viewer
The stack trace view is a simple table with three columns:
- Stack Frame
-
the function name or, if the name is unavailable, a placeholder such as "<unknown>".
- IP
-
the current instruction pointer for that frame (shown in hexadecimal).
- FP
-
the stack frame pointer (also hexadecimal).
Selecting a Frame
Click on any row to make it the active frame. As soon as a frame is selected, the variables view beneath will refresh to show the locals and arguments that were in scope at that point in the execution. The debugger automatically keeps the two panes in sync.
Context Menu
Right‑clicking a frame opens a small menu with the following action:
-
Disassemble Function – request that the disassembly view show the machine code for the function associated with that frame. This is especially useful when debugging at the assembly level. If the frame does not have symbol information, the menu item will be disabled.
The context menu only appears when you click on a non‑empty row. Use it after the program has paused (for example, on a breakpoint or exception).
Variables Viewer
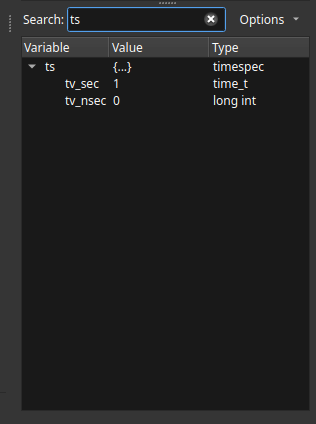
The variables view shows a hierarchical tree of the variables that are in scope for the currently selected frame. Each row has three columns:
- Variable
-
The name of the variable or structure field.
- Value
-
The current value. This field can show primitive types, strings, pointer addresses, array contents, etc. Long values are truncated with a tooltip that appears when you hover the mouse over the cell.
- Type
-
The data type as reported by the debugger’s symbol information.
Expanding Nodes
Composite types (structures, classes, arrays, etc.) are shown with a small triangle that you can click to expand and collapse. Expanding a pointer will trigger the debugger to fetch the pointed‑to data and show it as child entries.
Searching and Filtering
At the top of the variables pane is a Search: field. Type any substring to filter the tree; only variables whose names match the search text (case‑insensitive) will remain visible. Parent entries are also shown if any of their children match, which makes it easy to find a field buried deep inside a structure.
The search field has a clear button to quickly remove the filter and show everything again.
Display Options
Next to the search field is an Options button. Clicking it reveals a menu with two mutually exclusive settings:
-
Decimal – display numeric values in the usual base‑10 form (the default).
-
Hex – show numbers in hexadecimal. This affects all values in the table, including addresses, and is often more convenient when working with low‑level code or memory dumps.
Changing the option updates the values immediately.
Context Menu
Right‑click anywhere in the variables tree to open a context menu with the following actions:
-
Clear Variables – empties the view. This is helpful when you want to remove stale data before stepping the target or switching threads.
-
Dereference to Memory Inspector – available when right-clicking a pointer variable. The Inspector view opens with the memory at the pointer’s address interpreted. See Inspector View for more details on memory type inference.
There is no "copy" action; to copy a value simply select the cell and use the normal keyboard shortcuts for your platform.
Pointer Handling
When the debugger knows that a value is a pointer, it automatically displays the address in hexadecimal and, if the pointed‑to type is available, attempts to read the memory at that address. If the read succeeds, the pointer entry will be annotated so that you can expand it and see the dereferenced fields. This happens transparently, without any extra clicks.
If the debugger is unable to dereference a pointer (for example, if the address is invalid or the type is unknown), the value column will show an error message such as "<error>".
Thread Changes and Clearing
If the debugger switches threads (for example, when stepping or when a thread becomes active), the stack trace view will be updated automatically for the new thread. The variables pane is cleared and then repopulated when you click a frame.
Tips
-
Resize the splitter to give more room to the pane you are currently interested in.
-
Use the search field to quickly locate a variable when working with large data structures.
-
Switch between hex and decimal displays depending on whether you are looking at addresses/masks or human‑readable numbers.
-
Right‑click a frame and choose Disassemble Function to jump to the code for that stack frame in the disassembly view.