CTF & Timeline Views User Guide
Make the most of the CTF tracing facilities and associated timeline views in the TEMU System Debugger.
Overview
The debugger can connect to a running TEMU instance using the TCF protocol and request Common Trace Format (CTF) data from software contexts. When tracing information is available it is presented in one or more timeline panels that allow you to see events, thread activity, variable changes and more. The timeline subsystem is designed to be flexible: you can zoom, pan, detach views, follow the latest data, and combine multiple series in a single container.
Getting Started with CTF Tracing
-
In the main toolbar and under the CTF item, use the \[Start Polling] and \[Pause Polling] toolbar buttons to control automatic fetching of CTF data. Polling will continue in the background until you pause it or close the debugger.
-
The drop‑down list next to the buttons shows available software contexts; if none are selected the first context will be used.
-
The bottom status bar displays Simulated Real Time and other time messages as data arrives.
| Variable sampling must be set in TEMU by creating a Trace Sampler model and connect it to the system timesource such as a cpu. Next attach properties of the models which will be displayed in series. |
TraceSampler.new name=sam
connect-timesource obj=sam ts=l2-cpu
sam.add prop=wave.output
sam.add prop=wavier.output
sam.add prop=wavierer.output
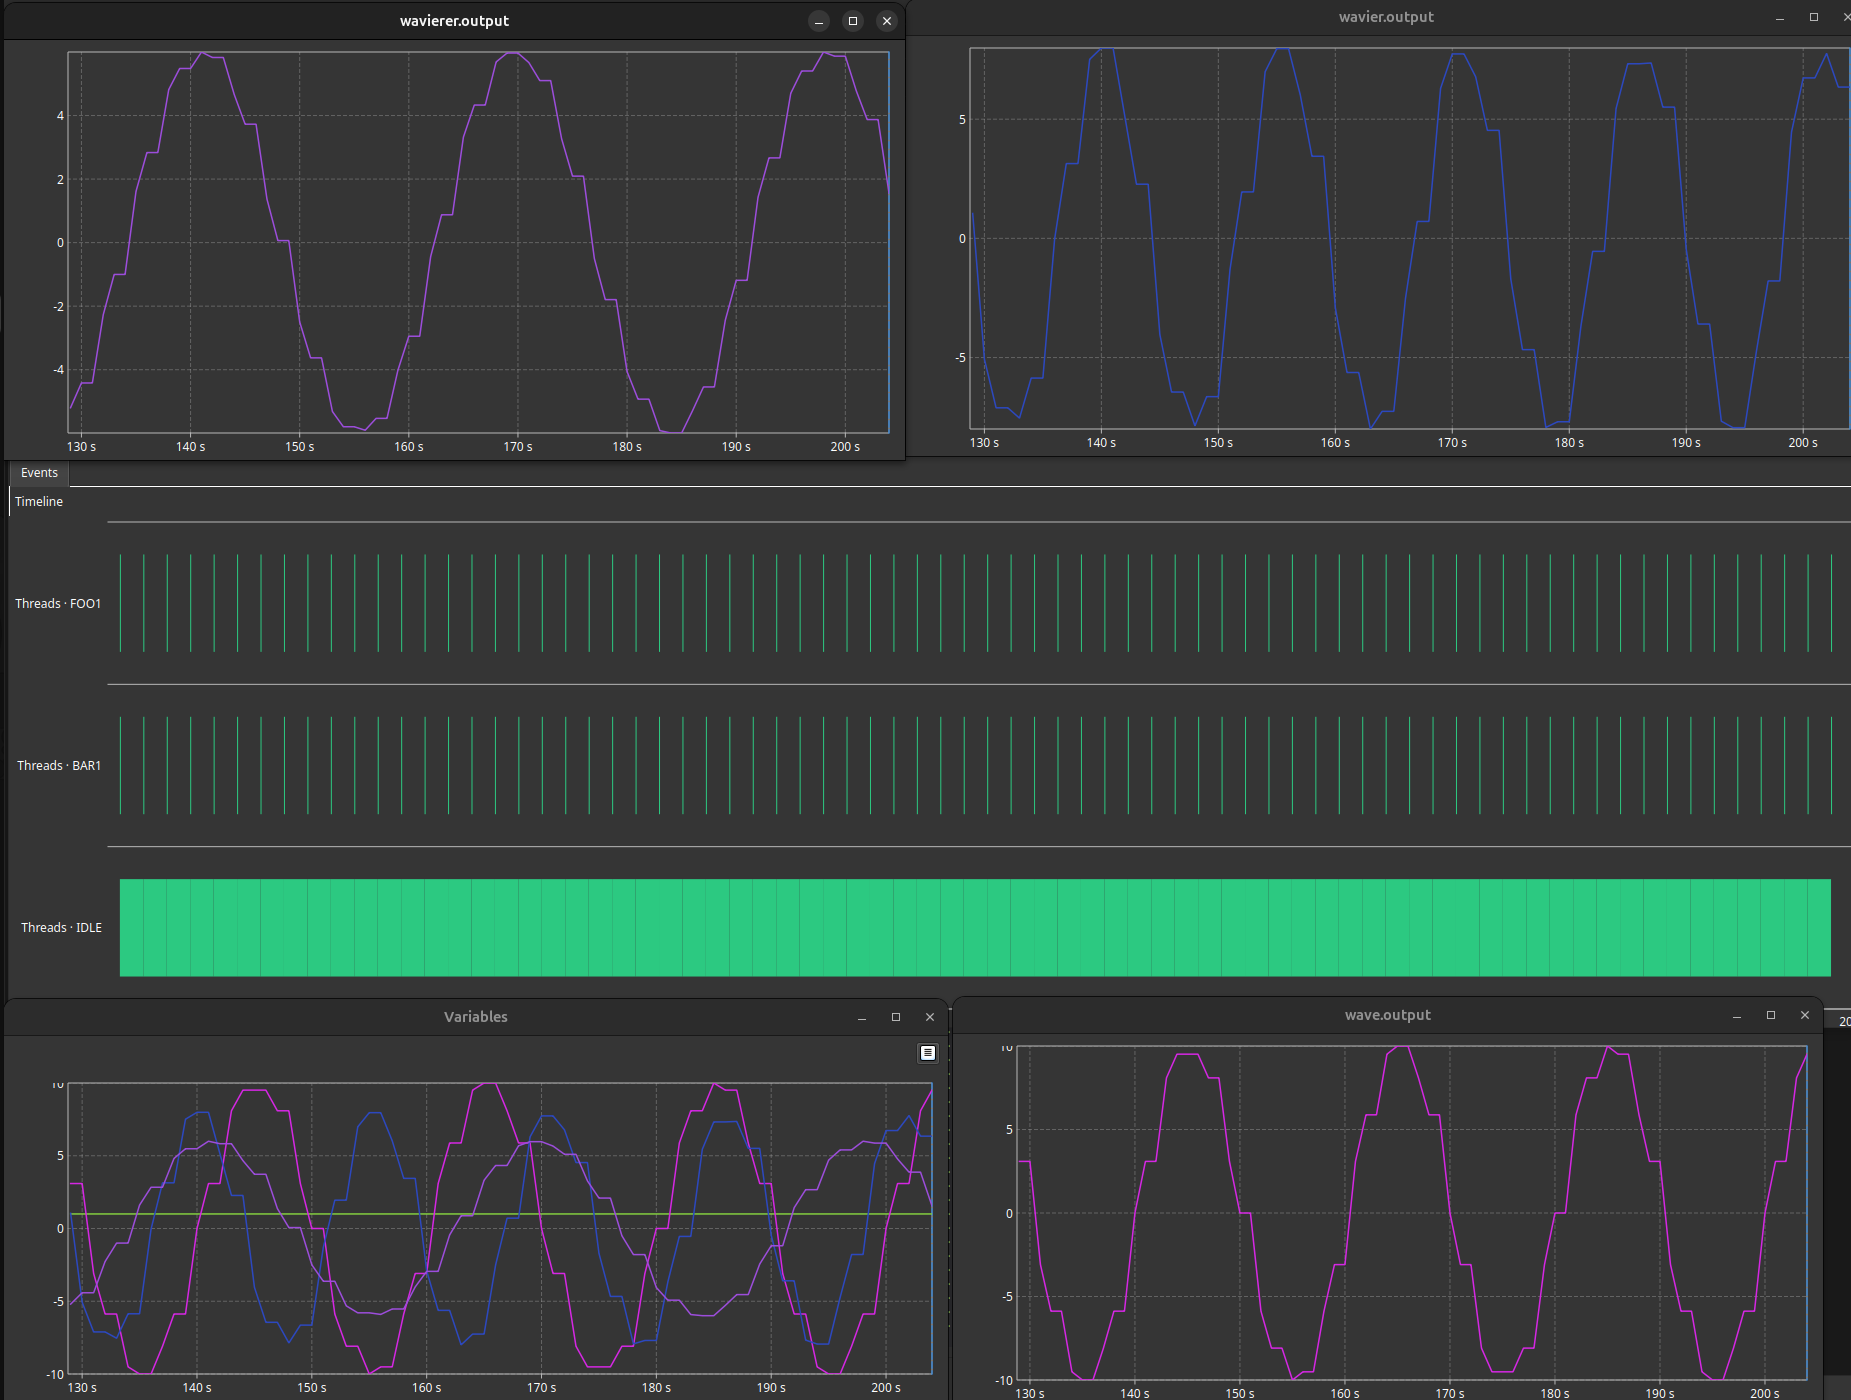
sam.add prop=l2-cpu.pcTimeline Container and Docking
The Timeline area is implemented as a dockable panel that you can move
around, tile with other docks, or turn into a separate window. It is made
up of a TimelineContainer which hosts one or more individual timelines.
-
Tabs appear along the top when multiple timelines are present. Click a tab to switch between them.
-
Right‑click a tab to open a context menu with the Pull Out Timeline action. This will detach the timeline into its own floating window.
-
Detached timelines remain linked to the container and will reattach when you close the floating window (unless you tagged them as transient).
Working with a Single Timeline
Each timeline represents a sequence of events over time. It may contain multiple series (for example, variable values) or a single stream such as context‑switch events.
Time Range and Current Time
-
The horizontal axis shows the current time range. You can set the span by dragging with the middle‑mouse button or using the zoom controls.
-
A vertical marker indicates the current time. It moves automatically when Follow Latest is enabled (see below) or you can click on the timeline to move it manually.
Zooming and Panning
- Mouse Wheel
-
rotate to zoom in (forward) or out (backward).
- Middle‑Button Drag
-
click and hold the middle mouse button, then move left or right to pan the view.
Follow Latest
Right‑click anywhere on a timeline and choose Follow Latest from the context menu, or toggle the button in the timeline control bar. When enabled the view will automatically scroll so that the newest data points are always visible. This is especially handy during live polling.
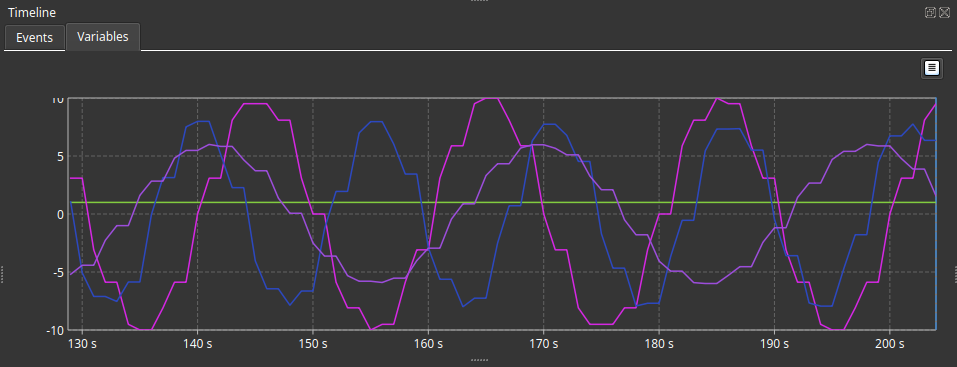
Detaching Series
Some timelines (such as variable traces) may contain multiple named series within a single view. A context‑menu or toolbar action allows you to "pull out" individual series into their own timeline so you can compare or arrange them independently.
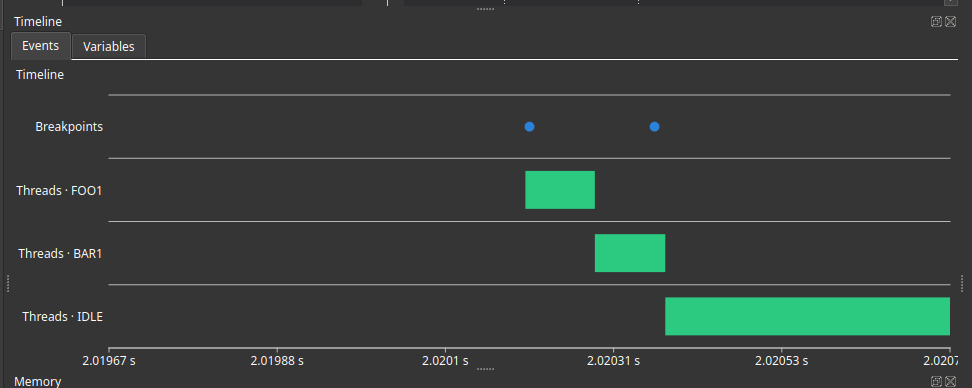
Contexts and Events
The debugger displays the context identifier for the trace in the timeline header. Events are translated from raw CTF records into human‑readable entries such as thread switches, function calls, or variable updates.
-
Thread switch events are automatically highlighted and can optionally display the previous and next thread names.
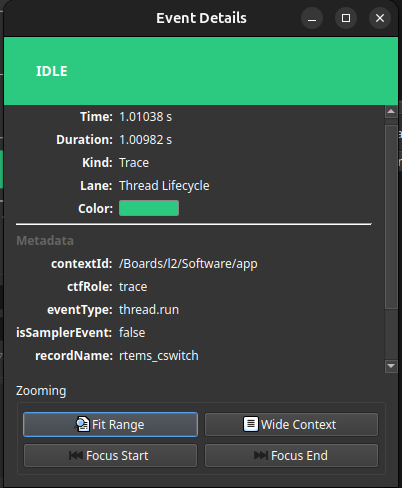
-
You can inspect the fields of any event by hovering or using a dedicated event list (depending on the timeline type).
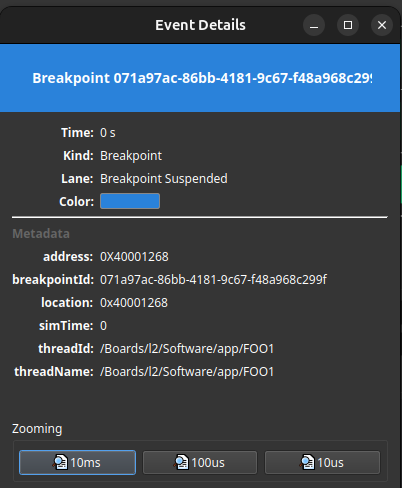
Breakpoint Integration
When you set breakpoints and run the debugger, the timeline controller may receive timestamps for each hit. These times appear as markers on suitable timelines, allowing you to correlate trace data with breakpoint activity.
Tips & Tricks
-
Use the View → Timeline menu or toolbar to show/hide the timeline dock on demand.
-
When the timeline window becomes crowded, detach some views and resize them independently.
-
Combine CTF data with logging and source views by arranging docks side by side – you can drag the timeline dock next to the log or source editor.
Troubleshooting
-
If no CTF contexts appear, ensure the TEMU instance was started with tracing enabled and that the TCF connection is active (check the status bar). Reconnect or restart polling if necessary.
-
If a detached timeline window disappears unexpectedly, look for a checkbox in its title bar labeled Keep on Close – disabling it will make the timeline transient.
Keyboard Shortcuts
-
Space – Open Variable timeline filter options.
-
Alt+←/→ – switch between timeline tabs (if numbered).
-
Ctrl+Wheel – zoom centered around cursor (if supported).