Execution Control
Overview
The Run Control Bar is the primary interface component for controlling program execution within the TEMU System Debugger. It provides both forward and reverse execution controls, context selection, and connection management all from a single toolbar.

Accessing the Run Control Bar
The toolbar normally appears at the top of the main window. It can be docked to any edge of the application window or floated as a separate panel. Drag the bar by its grip to move it.
Context Selection
-
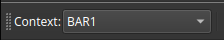
A labelled dropdown (
Context:) lets you choose the CPU or thread context for execution. Only contexts that support execution are listed. -
When context discovery is in progress, the dropdown is disabled and shows "Discovering contexts…".
-
Selecting a context updates the entire debugger to operate on that context. The dropdown reflects the current active context when it changes elsewhere in the UI.
-
The minimum width ensures names are readable; long names may be truncated.
Forward Execution Controls
The forward controls are grouped together and separated from other categories by visual separators.

- Continue
-
Resumes execution from the current location. Shortcut: F5. Icon: ▶.
- Pause
-
Suspends execution at the nearest suspendable point. Shortcut: F6. Icon: ⏸.
- Step Over Instruction
-
Execute the next instruction, treating function calls as a single step. Shortcut: Shift+F10.
- Step Into Instruction
-
Execute the next instruction and enter any called functions. Shortcut: Shift+F11.
- Step Over Line
-
Step to the next source line, skipping over function calls. Shortcut: F10.
- Step Into Line
-
Step to the next source line, entering calls. Shortcut: F11.
- Finish Function
-
Resume until the current function returns. Shortcut: Shift+F5`.
Tooltips appear when hovering over each button, including the shortcut key for quick reference.
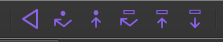
Reverse Execution Controls
Reverse debugging buttons mirror the forward controls and allow stepping backwards through execution history. Icons and tooltips make it clear that time is moving in reverse.
- Reverse Continue
-
Resume execution backwards until a breakpoint or user stop.
- Reverse Over Instruction
-
Step backwards one instruction, skipping calls.
- Reverse Into Instruction
-
Step backwards into any called function.
- Reverse Over Line
-
Step backwards one source line, skipping calls.
- Reverse Into Line
-
Step backwards into a line’s function calls.
- Reverse To Call
-
Go backwards until reaching the last call instruction (opposite of Finish).
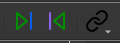
Active Context Controls
When working with multiple contexts the following buttons help re‑synchronize with the active context state:
- Resume Until Active
-
Run forwards until the context becomes active again.
- Reverse Until Active
-
Run backwards until the context becomes active.
These buttons are useful in multi‑core or multi‑thread scenarios where contexts may be scheduled in and out.
Connection Controls
A connection icon appears at the right-hand end of the bar. Clicking it opens an overflow menu with the following options:
- .
-
Open the connection dialog to attach to a TCF agent. This launches a pop‑up that temporarily hides other menus and dialogs.
-
Detach from the current TCF agent immediately.
-
Start the TEMU emulator instance if supported.
-
Stop the emulator process.
The menu is accessible via mouse or keyboard and remains the same regardless of whether the bar is docked or floating.
Tooltips, Icons & Shortcuts
Every button has a descriptive icon and a tooltip that appears on hover. Most actions also provide a keyboard shortcut displayed in the tooltip. Familiarity with these shortcuts can greatly speed up debugging.
Mouse/Keyboard Interaction
-
Click a button to invoke its action.
-
Use the keyboard shortcuts for faster operation.
-
The context drop‑down responds to mouse clicks and keyboard navigation (arrow keys, type‑ahead).
-
The bar supports standard Qt drag‑and‑drop docking behavior and can be hidden or shown via the
Viewmenu.
Behaviour During Context Discovery
When the debugger is refreshing available contexts, the context dropdown is disabled and a message informs the user. Execution buttons remain functional but will log a message if no valid context is selected.
Guidelines & Tips
-
Always select the correct context before issuing run or step commands. An invalid context will be ignored, and a message appears in the debug log.
-
Reverse debugging requires that the target supports recording execution history (TEMU 5 does). Reverse Execution must also be enabled in TEMU before it can be used in the debugger. Use reverse controls carefully—they may take longer than forward steps.
-
When connecting to remote targets, the connection pop‑up will take focus; ensure other modal dialogs are closed first.