Main Interface Overview
The TEMU System Debugger main window combines a central code workspace with multiple dockable tool panels. The arrangement is optimized for switching quickly between source-level and system-level debugging tasks.
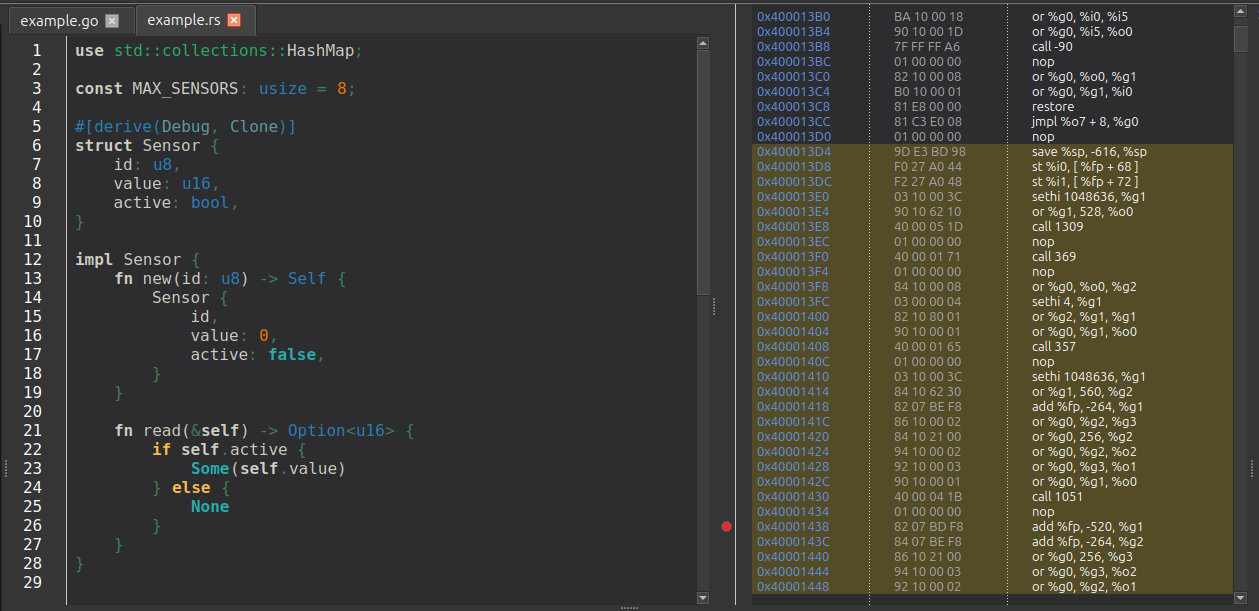
Central Workspace
The center of the window hosts the source and disassembly views. Use , , or to choose the layout.
-
Ctrl+1 switches to source only.
-
Ctrl+2 switches to disassembly only.
-
Ctrl+3 restores the split view.
-
In split mode, a horizontal splitter separates the two panes and remembers the last usable size ratio.
-
If another action needs a hidden pane, such as jumping to source or disassembling a symbol, the debugger automatically makes that pane visible.
Run Control Toolbar
The run control toolbar is docked at the top of the window by default. It contains the execution buttons, reverse-debugging controls, context selection, and the connection menu described in Execution Control.
Default Dock Layout
Around the central workspace, the debugger creates several dock widgets. Their default placement is:
- Left side
-
Components, Breakpoints / Watchpoints, Complex Breakpoints, and Project Explorer. These views are tabbed together so you can switch between them without consuming extra horizontal space.
- Right side
-
Stack Trace & Variables and the Inspector View. The Inspector provides symbol, memory, and timeline event inspection capabilities in a unified tabbed interface.
- Bottom side
-
Terminal, Memory, Registers, and Object Properties are tabbed together, while Logs and Timeline form a second bottom-side group.
Every dock can be moved, floated, or merged into a different tab group. More detail is covered in Customizing the Layout.
Menu Bar
The main menus expose the high-level GUI controls:
- File
-
Contains application-level actions such as .
- View
-
Holds the central layout actions for source, disassembly, and split view.
- Main window
-
Controls global dock behavior, including animated docks, nested docks, tabbed docks, vertical tabs, and grouped dragging.
- TCF
-
Provides connection and run-control commands from the same services used by the run control toolbar.
- CTF
-
Contains timeline polling controls and target-context selection for trace collection.
- Dock Widgets
-
Contains the dock-corner assignment menus.
- About
-
Opens the About dialog.
Status Bar
The status bar shows two kinds of information:
-
Temporary status messages appear on the left.
-
The Simulated Real Time (SRT) display appears on the right and updates as time information arrives from the target.
