Source Code View
The Source Code View is the main editor used when you inspect the target’s program text. It provides a tabbed interface for opening, browsing and editing source files while you are debugging.
Opening & managing files
-
Double‑click a file in the File Explorer (or any project tree) to open it in a new tab. If the file is already open the existing tab will be activated instead.
-
Recent files remain visible as tabs for one‑click access.
-
Drag tabs to reorder, or right‑click a tab for options such as Close, Close Others or Split Editor.
-
Cycle through open tabs with
Ctrl+Tab/Ctrl+Shift+Tab.
Tabs are identified by their full canonical path, so you won’t accidentally open the same file twice from different locations.
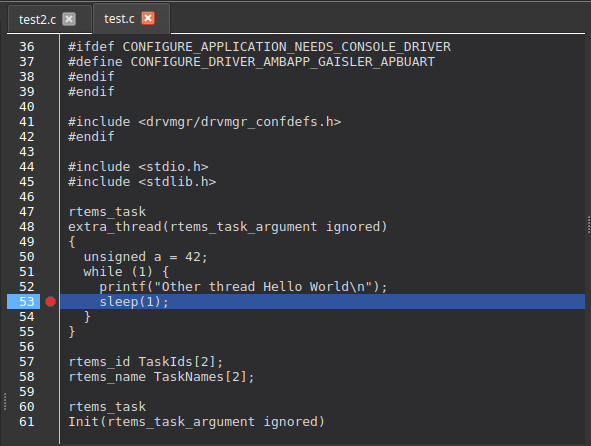
Execution‑Point Indicators
-
When the debugger is paused the line currently being executed is highlighted in the active source tab.
-
If several threads are stopped, each thread is marked with a coloured band beside its line; hovering shows the thread’s ID or name.
-
Picking a different stack frame in the call‑stack panel moves the highlight to that frame’s location.
-
The view scrolls automatically to keep the highlighted line visible when you step through code.
Breakpoints from the source view
-
Click in the left gutter (the margin beside line numbers) to toggle a breakpoint on that line. A red circle marks an active breakpoint.
-
Breakpoints set here are kept in sync with the debugger and remain between sessions.
-
Disabled breakpoints appear as hollow circles.