Inspector View
The Inspector is a powerful multi-purpose panel for examining symbols, memory regions, and timeline events within the TEMU System Debugger. It provides a unified interface for deep inspection of program state, type inference from raw memory, and event timeline analysis. The Inspector organizes inspections into three categories with support for pinning multiple items simultaneously, allowing you to maintain several inspection contexts while debugging.
Overview
The Inspector view presents three distinct categories of inspection data:
- Global Symbols (SYM)
-
Inspect global symbols by name and context. The Inspector reads the symbol’s type definition and displays all fields, nested structures, arrays, and primitive values in a hierarchical tree. You can search fields, toggle between hex and decimal formats, and dereference pointers to inspect referenced memory.
- Memory Inference (MEM)
-
Interpret raw memory at any address as a typed structure. When you know the type of data stored at a memory address but the debugger has no symbol for it, you can "assume" a type and view the bytes formatted according to that type definition. This is particularly useful for inspecting dynamically allocated structures, memory-mapped hardware registers, or serialized data.
- Timeline Events (EVT)
-
Examine individual timeline events or event aggregates. Click on a timeline event to view its metadata, duration, kind, lane, and associated properties. Aggregate mode displays a range of events and provides quick navigation back to the timeline.
The Inspector dock supports multiple pinned entries per category. Each entry appears as a tab within its category card, preserving your inspection history as you navigate through the debugging session.
Opening the Inspector
The Inspector dock is available from the main menu or via a dock tab button. When first opened, the view displays "No items pinned." To populate the Inspector, trigger an inspection action from one of the following locations:
-
Right-click a symbol leaf in the Component Browser and select Inspect Symbol
-
Right-click memory bytes in the Memory View and choose Inspect Memory or Assume Type…
-
Click an event in the Timeline view to inspect its metadata
-
Right-click a pointer variable in the Variables panel and select Dereference
Each inspection request creates or updates a tab in the appropriate category.
Inspector Layout
The Inspector is divided into three category cards displayed vertically:
-
SYM – Global Symbol inspections
-
MEM – Memory Inference inspections
-
EVT – Timeline Event inspections
Each category card is collapsible and contains a tab widget for managing multiple pinned items. The category badge uses color coding for quick identification:
Tab Widget
Tabs within a category represent individual inspection entries. Tab titles show the symbol name, memory address, or event identifier. You can switch between tabs to view different inspections without losing data. Each tab displays:
-
Header information (symbol name, type, context, or address)
-
Status indicator (Loading, Populated, or Error)
-
Tree widget or event metadata panel
Global Symbol Inspection (SYM Category)
Global symbol inspection displays the complete type structure and current values for a selected symbol.
Triggering Symbol Inspection
-
Open the Component Browser dock.
-
Expand the tree to reveal the Symbols container under a software context.
-
Continue expanding until you reach a symbol leaf node.
-
Right-click the symbol leaf.
-
Select Inspect Symbol from the context menu.
The Inspector will create or update a tab in the SYM category card with the symbol’s name as the tab title.
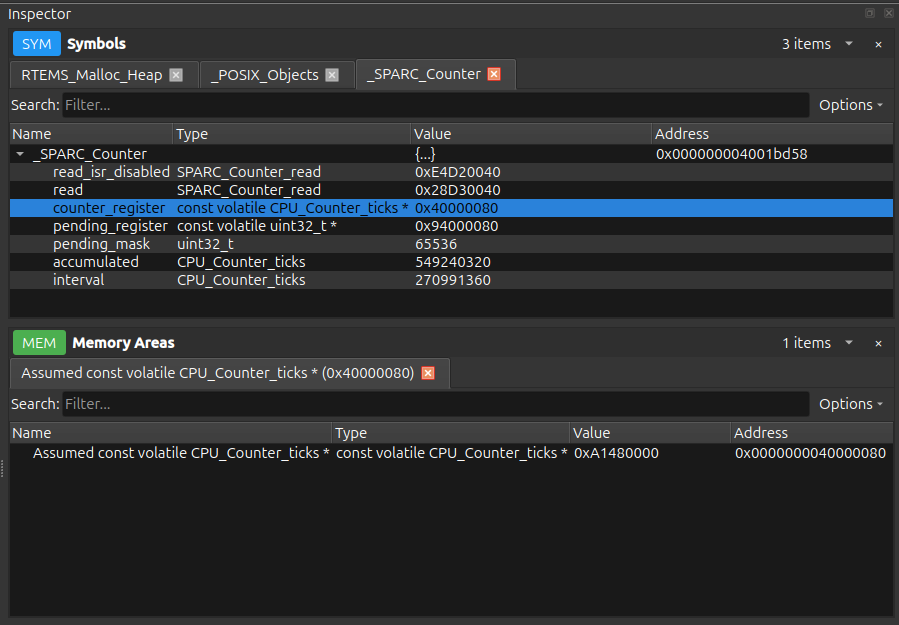
Symbol Tree Columns
The symbol inspection tree uses four columns:
- Name
-
The symbol, field, or array element name. Nested fields are indented to show hierarchy. Composite structures display
\{…}and can be expanded. Arrays display[n]where n is the element count. - Type
-
The data type as reported by the symbol service.
- Value
-
The current value formatted according to the type. Primitive types show numeric values or characters. Pointers show hexadecimal addresses. Strings embedded in char arrays are displayed with quotes.
- Address
-
The memory address where the field or symbol resides. Only populated for symbols with location information.
Pointer Dereferencing
Pointer fields in the symbol tree can be dereferenced to inspect the referenced memory:
-
Locate a pointer field in the tree (identified by the pointer type, e.g.,
int*). -
Right-click the pointer row.
-
Select Dereference Pointer from the context menu.
The Inspector will query the memory at the pointer’s address and attempt to interpret it according to the pointer’s base type. A new tab appears in the MEM category showing the dereferenced structure.
| Pointer dereferencing requires valid memory access and symbol type information. If the pointer is null or points to unmapped memory, an error message is displayed. |
Search and Filtering
The Inspector tree includes a search field at the top of the tab content. Type any substring to filter visible rows. The tree retains parent nodes if any child matches the search term, making it easy to locate deeply nested fields.
Search is case-insensitive and matches against the Name column.
Memory Inference (MEM Category)
Memory inference interprets raw bytes at a given address as a specific type, even when no symbol information exists for that address.
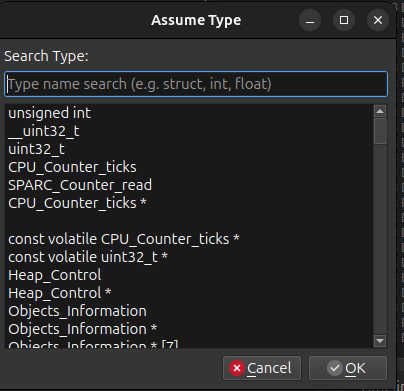
Assume Type Dialog
When you select Assume Type…, a dialog appears allowing you to search for and select a type:
-
Enter a search term in the Search Type field (e.g.,
struct,int,float, or a partial type name). -
Press Enter or wait briefly for the type list to populate.
-
Select the desired type from the list.
-
Click OK to apply the type interpretation.
The dialog fetches types from the debugger’s symbol service based on the active software context.
Common types like int, float, char, and void are available, along with all user-defined structures, unions, and typedefs.
Memory Inspection Display
Once a type is selected, the Inspector creates a new tab in the MEM category.
The tab title shows the memory address in hex format (e.g., 0x10004000@contextID).
The tree structure is identical to symbol inspection.
The Inspector reads raw bytes from the target memory and interprets them according to the type definition, taking into account endianness and alignment.
Endianness Handling
Memory inference respects the target context’s endianness setting. Multi-byte values are interpreted as big-endian or little-endian according to the context properties.
If you dereference a pointer from a symbol or memory tree, the endianness is inherited from the parent inspection context.
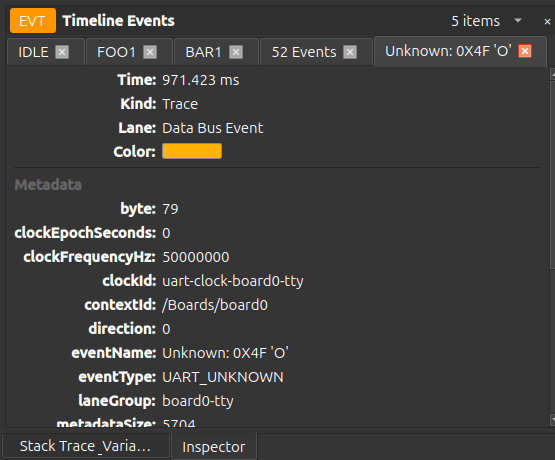
Timeline Event Inspection (EVT Category)
Timeline event inspection displays metadata and properties for individual events or event aggregates from the Timeline view.
Triggering Event Inspection
Click any event rectangle in the Timeline view to inspect it. The Inspector creates a tab in the EVT category with the event’s unique identifier as the tab title.
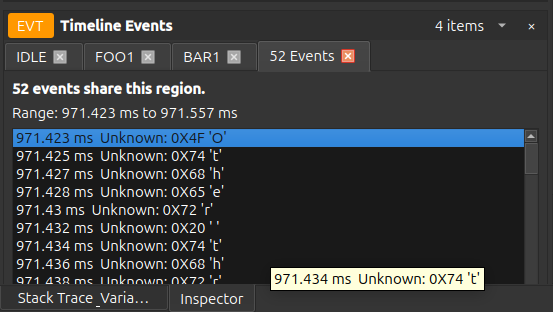
For event aggregates (multiple events within a time range), click the aggregate indicator to open a grouped inspection showing all events in the range.
Event Metadata Display
Below the metadata, a tree or list displays all key-value properties associated with the event. Properties vary by event type and may include function names, return values, CPU context IDs, and other debugging information.
Error Handling
If an inspection fails, the Inspector displays an error message in the tab content area:
-
Symbol not found: The requested symbol does not exist in the current context.
-
Memory read failed: The memory address is invalid or inaccessible.
-
Type resolution failed: The assumed type could not be loaded from the symbol service.
-
Context unavailable: The target context disconnected or is no longer valid.
Errors are shown in red text with a brief description. You can unpin the failed tab and retry after correcting the issue.
Keyboard Shortcuts
The Inspector supports standard keyboard navigation:
- Ctrl+F
-
Focus the search field.
- Up / Down
-
Navigate tree rows.
- Left / Right
-
Collapse or expand tree nodes.
- Ctrl+C
-
Copy the selected value.
Integration with Other Views
The Inspector works with other debugger components:
- Component Browser
-
Symbol inspection requests originate from symbol leaves in the Component Browser tree.
- Memory View
-
Memory inspection and Assume Type actions trigger memory inference tabs in the Inspector. Selecting bytes in the Memory View and choosing an inspection action automatically populates the MEM category.
- Timeline
-
Clicking timeline events opens the EVT category with event metadata. You can zoom back to the timeline from the Inspector, creating a bidirectional workflow.
- Variables Panel
-
Pointer variables can be dereferenced. The Inspector opens a MEM tab showing the pointed-to memory symbol.
- Stack Trace
-
When debugging with call stack information, the Inspector can display symbols in the current stack frame context.
Troubleshooting
Memory inference shows incorrect values: Verify the assumed type matches the actual data layout. Check the endianness setting for the memory context. Ensure the memory address is aligned according to the type’s alignment requirements.
Pointer dereference fails with "Memory read failed": The pointer may be null, uninitialized, or point to unmapped memory. Use the Memory View to verify the pointer’s value before dereferencing.
Assume Type dialog is empty: The symbol service may not have loaded types for the current context. Ensure you have connected to a target with debug symbols and the software context is active.