Watchpoint Management
Watchpoints stop or notify on data access rather than on code location. In the TEMU System Debugger they are managed from the lower half of the Breakpoints / Watchpoints dock.
Opening the Watchpoint View
Open the Breakpoints / Watchpoints dock from the left-side tab group. The dock is vertically split:
-
Breakpoints in the upper section
-
Watchpoints in the lower section
Adding Watchpoints
You can create watchpoints from several GUI entry points:
- Gear menu
-
Click the gear button at the top of the watchpoint section and choose Add Watchpoint….
- Component Browser
-
Right-click a symbol leaf and choose Add Watchpoint.
- Source Code View
-
Right-click an identifier symbol and choose Set Watchpoint on "<name>".
The add/edit dialog is the main interface when you need to configure the target, access mode, size, or other conditions manually.
Watchpoint Settings Dialog
The Watchpoint Settings dialog is divided into three groups.
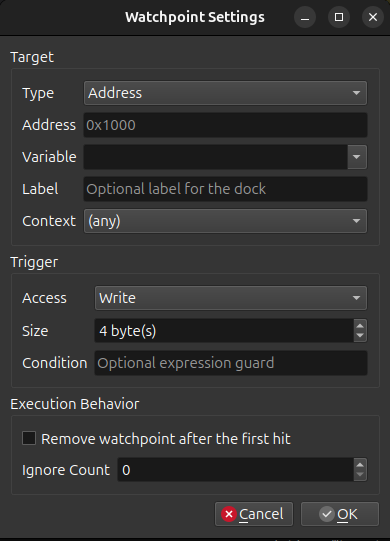
Target
- Type
-
Choose whether the watchpoint targets an Address or a Variable.
- Address
-
Enter a hexadecimal address such as
0x1000. - Variable
-
Search known component variables from an editable drop-down list.
- Label
-
Optional text used to make the watchpoint easier to recognize in the list.
- Context
-
Select the software context that should own the watchpoint.
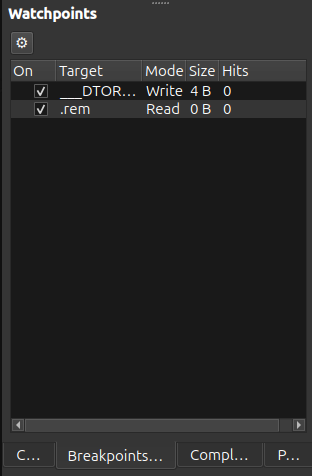
Managing the Watchpoint List
The watchpoint table shows one row per watchpoint with these columns:
- On
-
A check box that enables or disables the watchpoint.
- Target
-
The watched address, symbol, or custom label.
- Mode
-
The access type, such as Read or Write.
- Size
-
The watched size in bytes.
- Hits
-
The current hit count.
Hovering a row shows more detail, including the selected context, condition, symbol path, ignore count, and whether the watchpoint is one-shot.
Toolbar and Context Menu Actions
The gear menu above the list provides:
-
Add Watchpoint…
-
Enable Selected
-
Disable Selected
-
Edit Watchpoint
-
Delete Selected
-
Clear All
Right-clicking a watchpoint row opens a smaller context menu with:
-
Edit Watchpoint
-
Delete
Deleting selected rows and clearing the list both ask for confirmation first.